Proper monitoring is vital to an application’s success. With the Elastic Stack you can consolidate several application’s logs in one place, be able to easily search and filter them, create data visualizations out of them and more. What’s more, integrating that functionality into your application can be done within minutes.
To follow along with this article, I encourage you to use the example project. The following commit provides the blank slate we need:
https://github.com/daniel-frak/spring-boot-kibana-demo/tree/4cc5579fef62af8275f8f0f001edac40410c3130
Prepare docker-compose services
The first step is to install Elasticsearch, Logstash and Kibana. The easiest way to do it is to create a docker-compose.yml file like this:
# ./docker/docker-compose.yml

version: '3.2'

services:

  elasticsearch:
    image: elasticsearch:$ELK_VERSION
    volumes:
      - elasticsearch:/usr/share/elasticsearch/data
    environment:
      ES_JAVA_OPTS: "-Xmx256m -Xms256m"
      # Note: currently there doesn't seem to be a way to change the default user for Elasticsearch
      ELASTIC_PASSWORD: $ELASTIC_PASSWORD
      # Use single node discovery in order to disable production mode and avoid bootstrap checks
      # see https://www.elastic.co/guide/en/elasticsearch/reference/current/bootstrap-checks.html
      discovery.type: single-node
      # X-Pack security needs to be enabled for Elasticsearch to actually authenticate requests
      xpack.security.enabled: "true"
    ports:
      - "9200:9200"
      - "9300:9300"
    healthcheck:
      test: "wget -q -O - http://$ELASTIC_USER:$ELASTIC_PASSWORD@localhost:9200/_cat/health"
      interval: 1s
      timeout: 30s
      retries: 300
    networks:
      - internal
    restart: unless-stopped

  # https://www.elastic.co/guide/en/logstash/current/docker-config.html
  logstash:
    image: logstash:$ELK_VERSION
    ports:
      - "5000:5000"
      - "9600:9600"
    environment:
      LS_JAVA_OPTS: "-Xmx256m -Xms256m"
      ELASTIC_USER: $ELASTIC_USER
      ELASTIC_PASSWORD: $ELASTIC_PASSWORD
      XPACK_MONITORING_ELASTICSEARCH_USERNAME: $ELASTIC_USER
      XPACK_MONITORING_ELASTICSEARCH_PASSWORD: $ELASTIC_PASSWORD
      XPACK_MONITORING_ELASTICSEARCH_HOSTS: "elasticsearch:9200"
      XPACK_MONITORING_ENABLED: "true"
    volumes:
      - ./logstash/pipeline:/usr/share/logstash/pipeline:ro
    networks:
      - internal
    restart: unless-stopped
    depends_on:
      - elasticsearch

  # https://www.elastic.co/guide/en/kibana/current/docker.html
  kibana:
    image: kibana:${ELK_VERSION}
    environment:
      ELASTICSEARCH_USERNAME: $ELASTIC_USER
      ELASTICSEARCH_PASSWORD: $ELASTIC_PASSWORD
      # Because Elasticsearch is running in a containerized environment
      # (setting this to false will result in CPU stats not being correct in the Monitoring UI):
      XPACK_MONITORING_UI_CONTAINER_ELASTICSEARCH_ENABLED: "true"
    ports:
      - "5601:5601"
    networks:
      - internal
    restart: unless-stopped
    depends_on:
      - elasticsearch
      - logstash

networks:
  internal:

volumes:
  elasticsearch:
Place this file in the ./docker folder (you will have to create it). You will also need the .env file, which defines the variables used above:
# ./docker/.env

COMPOSE_PROJECT_NAME=spring_boot_kibana_demo
ELK_VERSION=7.6.1

# Note that there is currently no known way to change the default Elasticsearch username!
ELASTIC_USER=elastic
ELASTIC_PASSWORD=changeme
You could run the services now but Logstash would complain about the lack of a pipeline, so let’s hold on for now.
A diff of these changes is available at:
https://github.com/daniel-frak/spring-boot-kibana-demo/commit/3052be181f0147f1787eca4cb17d486bee130c4f
Configure Logstash to send logs to Elasticsearch
Logstash needs to have a pipeline configured for ingesting logs and sending them to Elasticsearch. To do that, create the file ./docker/logstash/pipeline/logstash.conf:
# ./docker/logstash/pipeline/logstash.conf

input {
    tcp {
        port => 5000
        type => syslog
        codec => json_lines
    }
}

filter {
    grok {
        match => [ "message", "%{GREEDYDATA}" ]
    }
    mutate {
        add_field => { "instance_name" => "%{app_name}-%{host}:%{app_port}" }
    }
}

output {
    stdout { # This will log all messages so that we can confirm that Logstash is receiving them
        codec => rubydebug
    }
    elasticsearch {
        hosts => [ "${ELASTIC_URL}" ]
        index => "logstash-%{+YYYY.MM.dd}"
    }
}
You can now run the Docker services by executing the following command in the ./docker directory:
docker-compose up -d
If you later want to stop the services, you can do so using the docker-compose down command.
A diff of these changes is available at:
https://github.com/daniel-frak/spring-boot-kibana-demo/commit/8ed0d520eadad6a8974dfd40b8745d6d1285a297
Configure Spring Boot to send logs to Logstash
Finally, the Logstash encoder for Logback must be added to the project as a dependency and Logback must be configured to use it. This encoder will automatically send the application’s logs to Logstash. If using Maven, the required dependency is:
<dependency>
  <groupId>net.logstash.logback</groupId>
  <artifactId>logstash-logback-encoder</artifactId>
  <version>6.3</version>
</dependency>
Create a file called logback-spring.xml in ./src/main/resources:
<?xml version="1.0" encoding="UTF-8"?>
<!DOCTYPE configuration>

<configuration scan="true">
    <include resource="org/springframework/boot/logging/logback/base.xml"/>

    <springProperty scope="context" name="app_name" source="spring.application.name"/>
    <springProperty scope="context" name="app_port" source="server.port"/>
    <springProperty scope="local" name="logstash_host" source="logstash.host"/>
    <springProperty scope="local" name="logstash_port" source="logstash.port"/>

    <appender name="logstash" class="net.logstash.logback.appender.LogstashTcpSocketAppender">
        <param name="Encoding" value="UTF-8"/>
        <remoteHost>${logstash_host}</remoteHost>
        <port>${logstash_port}</port>
        <encoder class="net.logstash.logback.encoder.LogstashEncoder"/>
    </appender>

    <root level="INFO">
        <appender-ref ref="logstash"/>
    </root>
</configuration>
The above uses spring.application.name, server.port as well as two custom variables: logstash.host and logstash.port to configure the appender, so make sure they exist in your application.properties file:
server.port=8080
spring.application.name=spring-boot-kibana-demo
logstash.host=localhost
logstash.port=5000
A diff of these changes is available at:
https://github.com/daniel-frak/spring-boot-kibana-demo/commit/7158a202dae72f37e02ef000a3cc8b9e3c0107bb
Test the solution
To test if everything is working correctly, create a new controller with an endpoint which will generate logs:
package dev.codesoapbox.springbootkibanademo.controllers;

import org.slf4j.Logger;
import org.springframework.web.bind.annotation.GetMapping;
import org.springframework.web.bind.annotation.RestController;

@RestController
public class TestController {

    private static final Logger log = org.slf4j.LoggerFactory.getLogger(TestController.class);

    @GetMapping
    public void logTestMessage() {
        log.info("This is a test log");
    }
}
Make sure that all Docker services are running and navigate to http://localhost:8080 to generate a new log, which should now be intercepted by Logstash, sent to Elasticsearch and made readable in Kibana.
Navigate to http://localhost:5601 to access Kibana, log in using your Elasticsearch credentials and click the “Connect to your Elasticsearch index” button:

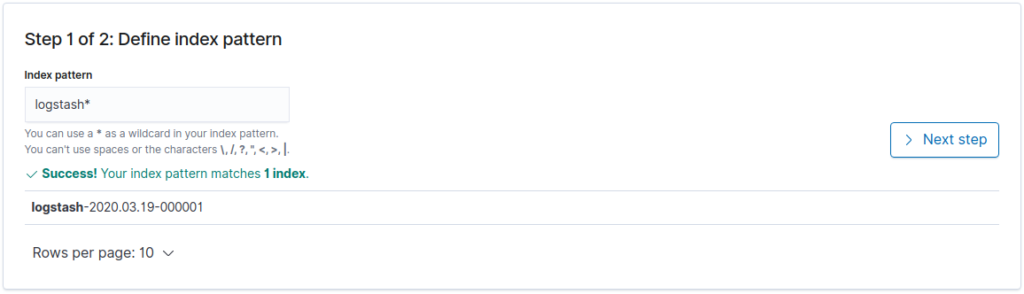
On the next page use “logstash*” as the index pattern and click “Next step“.
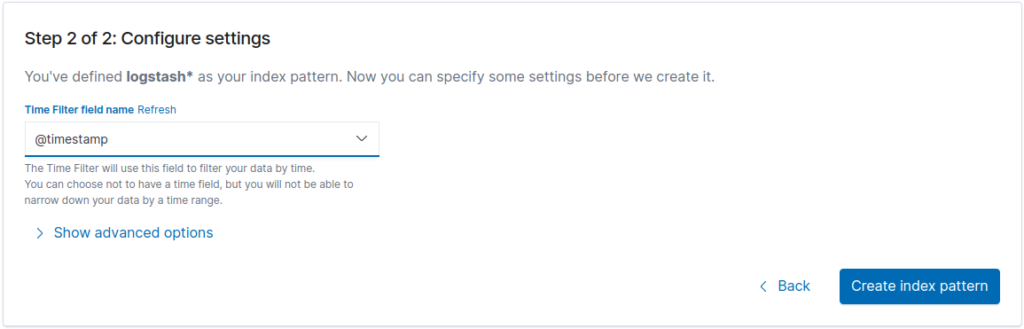
Lastly, choose “@timestamp” as the time filter field name and click “Create index pattern“:
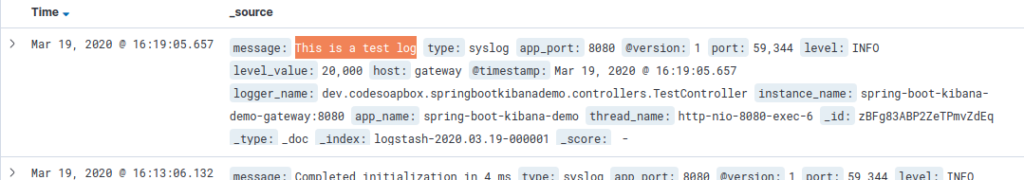
Click the “Discover” icon in the sidebar to start browsing your logs:
A diff of these changes is available at:
https://github.com/daniel-frak/spring-boot-kibana-demo/commit/d4f543169022d81b32f10230eb3ee7da87db078f
Conclusion
You can check out the complete demo project here:
[…] How to browse Spring Boot logs in Kibana (configuring the Elastic Stack) […]
How if my logstash is on the different server protected with username and password?
ELASTICSEARCH_USERNAME should be change to
ELATIC_USERNAME and the password to
I have updated the docker-compose variables somewhat. Let me know if they work for you now!
Hi Daniel
there is some problem that logstash won’t connect to elastic
error=>”Got response code ‘401’ contacting Elasticsearch at URL ‘http://elasticsearch:9200/’
I just ran a fresh version of the project and it’s working for me. Perhaps some lingering Docker volumes are the problem in your case?
I’ve updated the Github project to be one-to-one with the code in the post again, so see if you can run it on your machine (keep in mind you will most likely have to clone it again, as I have amended existing commits).